Lessons Learned from 1972: Noise Pollution Along the A10
At M+P, we have been dealing with noise pollution from passing traffic and its effects on quality of life for 50 years. Has all this research truly improved the situation? Absolutely! This clearly shows when we look back on the Amsterdam of 1972.
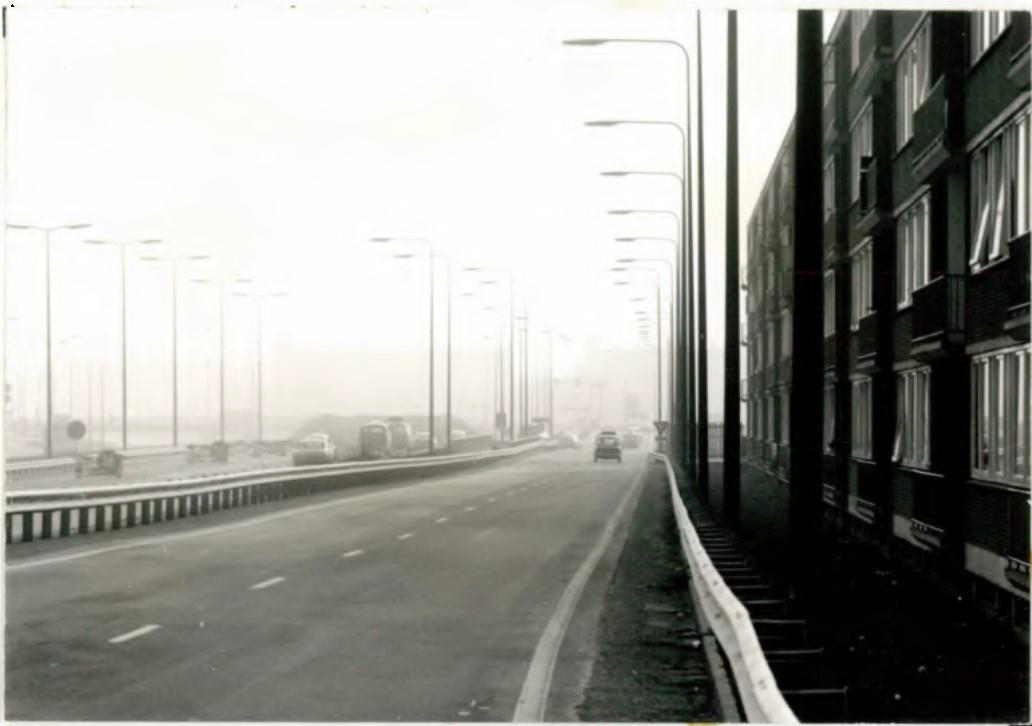
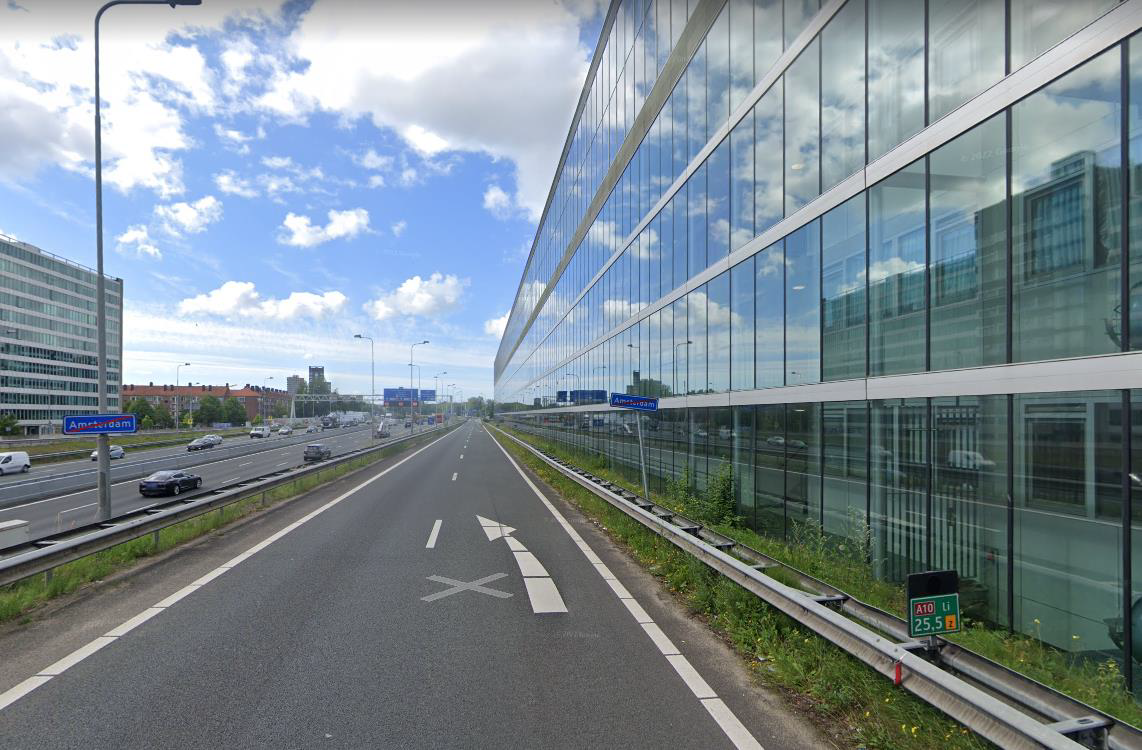
Driving along the A10 via Ringweg-West through Amsterdam, you pass a couple of apartment buildings that are very close to the motorway near the Kolenkitkerk. Can people continue to live with so much traffic noise? This question was already posed by housing foundation Patrimonium in 1972 when the road - then called Einsteinweg - was further extended. At M+P, we were therefore commissioned to find out what measures could be taken to limit noise pollution for the those buildings.
Front Facade
Whether and when the measures would yield sufficient results was not clear. Noise legislation was still missing back then. We had to rely on standards from other countries. In the end, we came up with three solutions: covering the road, installing a noise barrier with slats so you could see through it or installing a front facade. The latter was not our preference as it would have prevented the windows in the apartments from opening. But those who know the current situation know that the facade is there regardless. And, thanks to proper ventilation, this is not a problem.
Not Tackled at the Source
‘What is so interesting about the report from back then is that we never say anything about addressing the noise pollution at the source’, notes our current director Jan Hooghwerff. ‘Such source policy is precisely one of our key issues today. How can you make tyres and road surfaces quieter, for example? But ideas for this only came to fruition during the years that followed.’
Measurements: Then and Now
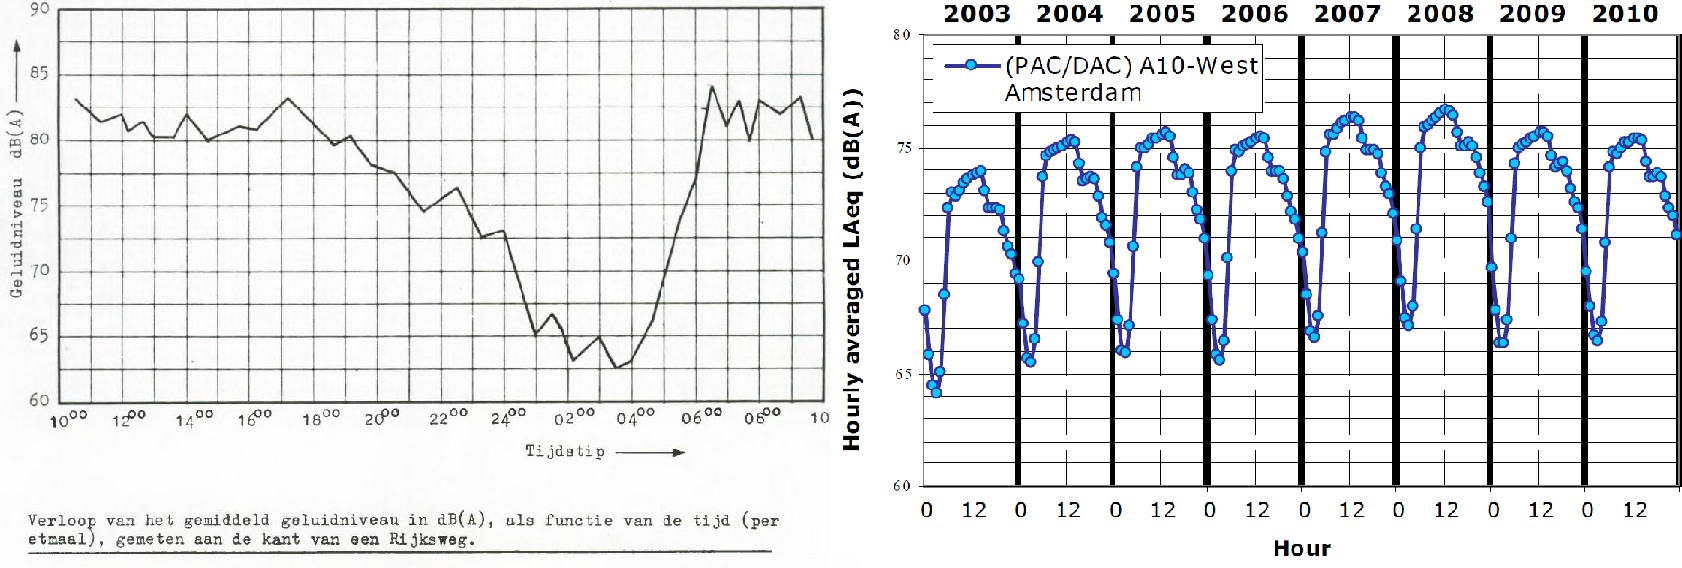
It gets even more interesting when you look at the measurement results in more detail. The great thing is that you can compare these with traffic noise measurements from the RIVM (National Institute for Public Health and the Environment), which has been monitoring noise and air quality at an apartment building across the street for the past 10 years. Jan: ‘At the time, our colleagues manually measured the noise level every 15 minutes, even at night. If you compare their graphs to those from the RIVM, you can see that the amount of traffic is still distributed the same way throughout the day.’
More Traffic, Less Noise
‘Yet there is an important difference: in 1972, the peak during rush hours was around 83 decibels. In 2010, it was 75 decibels, or 8 decibels less. And that while at least five times as many vehicles are driving around. On that basis, you would actually expect an increase of about 7 decibels. Thus, the measured noise level is actually about 15 decibels lower than expected. This is mainly because (freight) traffic now makes less noise and one of the quietest road surface types was installed there.’
Contributions to the Quality of Life
‘That is an important conclusion. People often feel that noise measures have little effect, but developments in quieter vehicles and road surfaces do make a difference. Quiet asphalt, such as two-layer OAC, absolutely limits the nuisance to residents of these buildings along the A10. This is how we truly contribute to the quality of life through our work. This makes me so happy!’